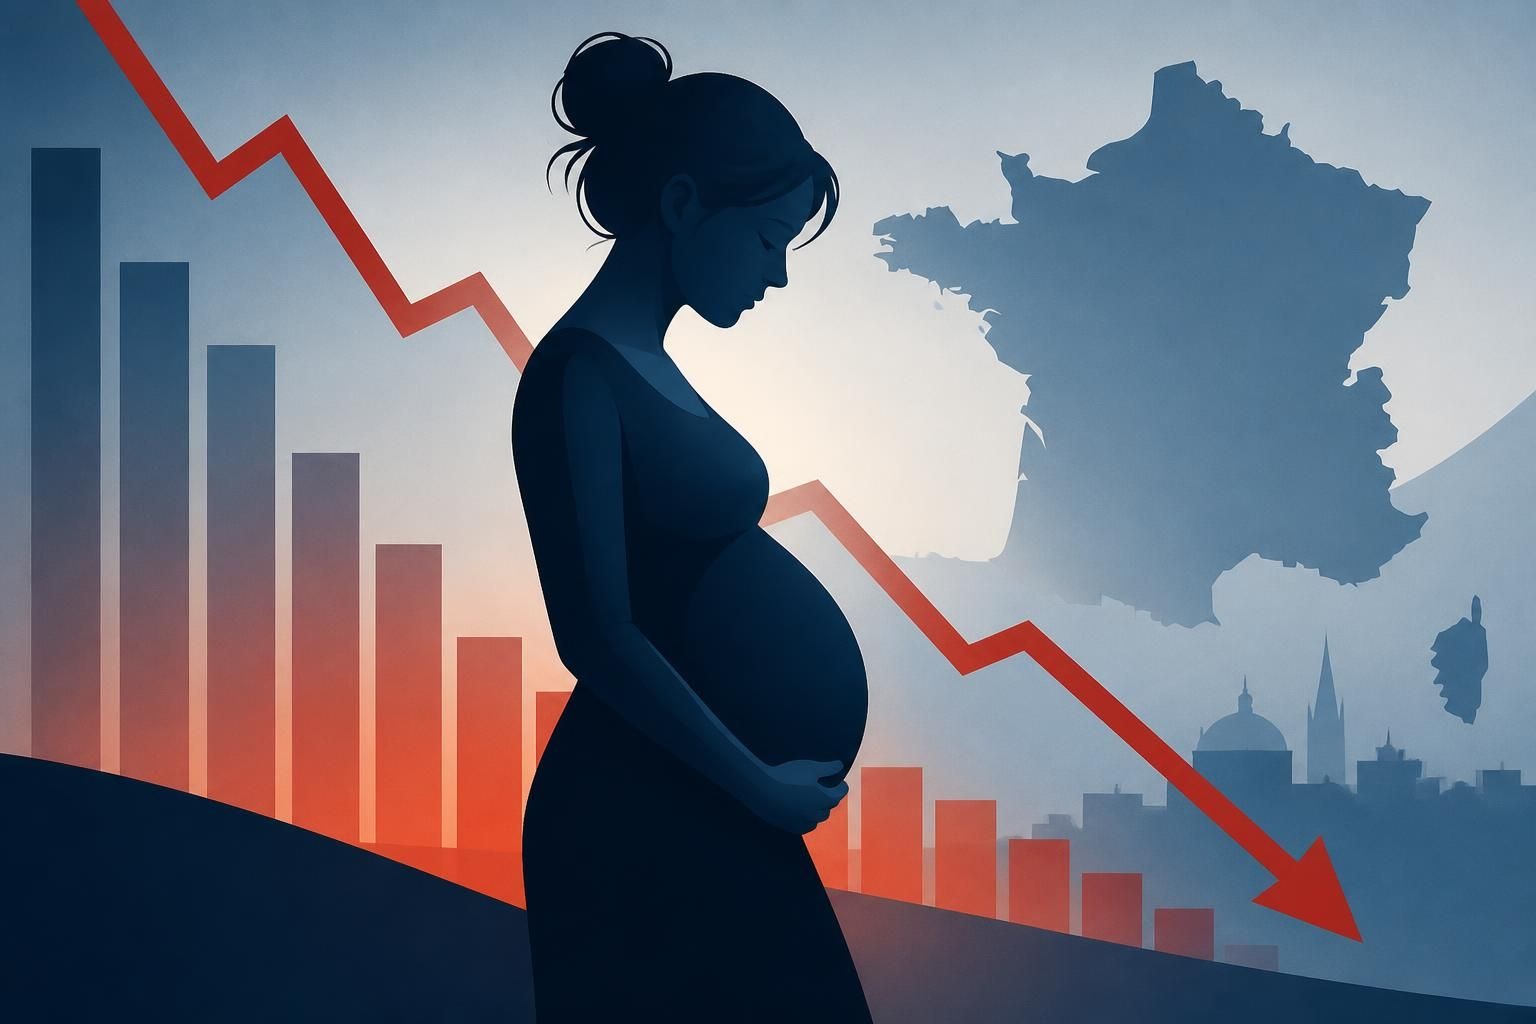
Birth rate in France: the persistent drop in births is worrying
On July 6, 2026, Insee added fuel to the collective worry machine: birth rates continue to decline in France, with 643,905 births recorded in 2025. The number doesn’t come alone; it aligns with a trend established for about fifteen years, although the pace of the decline seems less severe than in 2023. In family discussions, the topic slips in between a daycare quote and a notification of the average basket price, with the discreetness of an elephant in a china shop.
Behind this decrease lie very concrete questions: how is the population evolving, what happens to the balance between generations, and why is the birth rate contracting even though the desire for children doesn’t necessarily disappear. Demography is not just about filling in tables: it weighs on schools, housing, work, and pensions. And when fertility drops, everything else ultimately follows, sometimes with a delay that gives the illusion that “things are fine,” until the moment when classes close and recruitment stalls.
In Brief
- According to Insee (publication of July 6, 2026), 643,905 babies were born in France in 2025, which is -2.3% compared to 2024.
- The decline has lessened: -6.6% in 2023, -2.8% in 2024, then -2.3% in 2025.
- The 2025 level remains 24% lower than in 2010, the last recent peak of births.
- In 2024, the fertility rate in France is 1.61 children per woman, compared to 2.0 in 2014 (Insee).
- In the European Union, 3.6 million children were born in 2024, representing -3.2% year-on-year and -19% over ten years (European data reported by Insee).
Birth Rate in France: Recent Figures Confirming the Decline in Births
The decline in births in France is no longer a “weak signal.” The tipping point is repetition: year after year, the curve trends in the same direction, with varying amplitudes. Insee, in its July 6 publication, indicates that 2025 saw 643,905 births, 2.3% fewer than in 2024. On paper, the decrease seems “moderate.” In real life, these are thousands fewer cradles and a trajectory that finally imposes itself on the whole society.
The key detail is the dynamic. After a marked drop in 2023 (-6.6%), then a new decline in 2024 (-2.8%), the year 2025 continues the trend with -2.3%. The slope is therefore less steep, but it has not reversed. For public policies, this is a very particular scenario: it is more difficult to mobilize when the decline slows down, because the urgency seems less visible, while the accumulation of setbacks produces a massive effect over several years.
The historical reminder reinforces worry: Insee marks 2010 as the last recent peak, and 2025 shows a level 24% lower than that reference year. Concretely, this means a generation of “missing” children is gradually forming. The impacts are not immediately visible on a national dashboard, but they materialize locally: a primary school losing a class, a maternity ward reorganizing its shifts, or a municipality reviewing the size of its canteen project.
To avoid vague debates, a table helps visualize recent evolution. Percentages give the pace, but magnitudes help understand why the issue widely exceeds the family sphere.
| Measurable Indicator | Value | Period |
|---|---|---|
| Number of births | 643,905 | 2025 |
| Annual change in births | -2.3% | 2024 → 2025 |
| Annual change in births | -2.8% | 2023 → 2024 |
| Annual change in births | -6.6% | 2022 → 2023 |
| Gap in births compared to last peak | -24% | 2010 → 2025 |
Birth rate is often confused with fertility, although the two don’t exactly tell the same story. Births are an annual result, sensitive to parents’ age, project timing, and economic conditions. Fertility, measured via the total fertility rate (TFR), captures a more structural behavior. When both decline simultaneously, the drop becomes a durable demographic fact, difficult to correct with a simple budgetary boost.
One last point makes the issue less abstract: decisions are made “at the household level.” The timing of the first child, the gap between children, or the renunciation of a third, are very concrete trade-offs. When the environment makes these trade-offs more costly, the national curve ends up reflecting this addition of micro-decisions. The result displays prominently: fewer births, and a worry that settles in.
Demography and Population: Why the Drop in Births Changes the Balance Between Generations
Demography has a particular talent for seeming theoretical until it touches everyday organization. A durable drop in births changes the age structure of the population. The mechanism is simple: if fewer children are born for several years, the younger cohorts shrink, then effects move towards adolescence, higher education, and later, entering the labor market.
In the territories, this translates into chain adjustments. Municipalities size their services based on numbers: number of daycare places, classes, cafeterias, sports facilities. A durable decline in births can create a paradoxical situation: in the short term, pressure on some infrastructures decreases, which may seem “comfortable.” Then, the reverse effect appears with rising needs linked to aging, requiring other investments (healthcare, home aids, housing adaptation).
The pension debate is systematically influenced by these figures. The pay-as-you-go system depends on a balance between workers and retirees. When arriving generations are fewer, the base of potential contributors narrows, even if employment and productivity also play a role. The challenge is not a slogan: it is an equation that becomes more demanding when birth rate and fertility both decline simultaneously.
Schools, Health, Employment: Concrete Impacts with Different Horizons
The effects arrive in several waves. The first affects care for young children and kindergarten: fewer births mean numbers adjust quickly. The second concerns primary school, then middle school. Closing a class is not just a budget line: it involves transfers, regroupings, sometimes longer commutes. And when a school loses too many pupils, it may impact the residential attractiveness of the neighborhood.
The healthcare system also observes this evolution. A lower volume of births can influence the organization of maternity wards, team planning, and the territorial distribution of supply. This does not automatically mean improved care conditions: if resources follow a logic of rationalization, some areas may face longer journeys to maternity wards, even though obstetric safety relies on good accessibility.
Regarding employment, the effect is slower, but it eventually matters. Fewer potential entrants to the labor market is a challenge for sectors already under stress. Companies can partly compensate through training, improving working conditions, robotization, or immigration. However, these levers require time, investments, and political coherence. The drop in births acts like a quiet countdown: it isn’t noticeable at first, then timing becomes tight.
A List of Signals to Watch to Avoid Blind Steering
To monitor demographic evolution without relying on a single annual figure, several indicators deserve observation. They allow anticipation rather than reaction when the situation becomes visible in public services.
- The annual number of births by territory to identify areas where the decline is fastest.
- The average age at maternity and paternity, as postponing family projects changes birth timing.
- The natural balance (births minus deaths), useful to track population evolution excluding migration.
- Childcare capacity (daycares, childminders), which concretely influence the feasibility of having a child.
- Female employment rates and return-to-work conditions after childbirth, variables closely linked to family decisions.
Current concern also stems from a cumulative effect: fewer births today reduce the size of future generations, which can maintain the decline if nothing improves the reconciliation between family and professional life. The issue is not just statistical background; it is a constraint that settles into collective choices.
Demographic popularization videos have one advantage: they show the temporal lag. A change in birth rate impacts decades, and this is precisely what makes decisions difficult: the cost is immediate, the beneficial effect is often delayed.
Birth Rate and Fertility: What Indicators Tell and What They Don’t
In debates, “birth rate” and “fertility” are often used as synonyms, although they do not address the same question. The birth rate relates the number of births to the total population, making it sensitive to age structure: a country may have a low rate simply because it has proportionally fewer people of childbearing age. The total fertility rate aims to measure the average number of children per woman based on rates observed at each age.
According to Insee, France reported in 2024 a fertility rate of 1.61 children per woman, down from 2.0 in 2014. The decline is clear, and it points to a deeper change than simple “calendar shifts.” Falling below 2 children per woman is not just symbolic: it indicates that, without migratory flow, the population would eventually decrease in the long term because generational renewal is no longer assured.
The figure also needs to be placed in a European context. According to the latest European data reported by Insee, the EU average dropped from 1.54 in 2014 to 1.34 in 2024. Within this landscape, France maintains a relatively high position: Insee indicates it ranked second in the EU in 2024, behind Bulgaria. Being “well ranked” does not prevent decline, and the comparison does not console municipalities closing a class.
Why the Desire for Children Does Not Always Translate into Births
The gap between desire and realization is explained by concrete constraints. Housing is a classic: moving for an extra room often means higher rent or a bigger loan. Childcare is another friction point: when solutions are scarce or costly, daily organization becomes an obstacle course. The availability of relatives, workplace flexibility, and atypical hours also matter, including in essential jobs that do not stop at 6 p.m.
Reproductive health also plays a role, though not the only factor. Delaying the age of the first child mechanically increases the likelihood of encountering conception difficulties. Care pathways exist but can be long, emotionally draining, and dependent on local access to specialists. This topic is often treated in passing, even though it fully participates in national fertility trends.
Concrete Examples: How a “Micro” Decision Becomes a “Macro” Trend
A household waiting for a daycare place before starting a second family project is not making a “demographic choice,” it is making a logistical choice. A couple that gives up moving due to budget constraints is not “weighing” the birth rate, they are balancing their accounts. Yet, when these situations repeat on a large scale, they end up shaping national demographic evolution.
The same mechanism applies to careers. A period of precariousness, a short contract, a relocation, or demanding training can delay a birth. If the child arrives later, the interval to have another shrinks. At a country scale, this simple age shift can contribute to a lasting drop in births, even when the desire for children remains.
The most useful point to remember is methodological: one indicator alone explains nothing. One must look at the combination of age structure, material conditions, and access to services. Without this reading, worry goes in circles, and solutions stay at the slogan stage.
Educational contents about fertility allow distinguishing what relates to timing (having later) and what relates to behavior change (having fewer). This nuance changes the nature of possible political responses.
Demographic Evolution in Europe: The Decline in Births Surpasses France
Looking only at France gives the impression of a national exception, while the decline in births is a broad trend in Europe. European data reported by Insee show 3.6 million births in the European Union in 2024, a decrease of 3.2% in one year and 19% over ten years. This common trajectory suggests partly shared factors: cost of living, economic uncertainties, access to housing, work organization, and changes in family models.
In this context, France maintains a particular profile: a fertility level higher than the European average. This doesn’t mean the country is “protected.” Rather, it means it starts from a slightly higher point while following a downward slope. The concern lies in this combination: “doing better than neighbors” doesn’t prevent degradation, and the gap may narrow if the trend continues.
The European comparison also helps avoid too-quick explanations. If several countries with different social systems observe a decline, it is likely the cause is not unique. Family policies play a role but face deep forces: urbanization, professional mobility, rising real estate prices, difficulty reconciling careers and parenthood, and unequal access to services.
What France Keeps, What It Loses: A “Competitive” Reading of an Unappealing Subject
Demography has a “spreadsheet” side, but it influences a country’s ability to finance services, attract businesses, and support innovation. A dynamic active population weighs on potential growth, business creation, and the ability to absorb economic shocks. A durable decline in births mechanically reduces the size of future generations, unless compensated by other factors.
European countries respond in various ways: financial aid, parental leave, childcare policies, taxation, housing support. Results are heterogeneous and sometimes hard to attribute, as measures interact with culture and labor market. One point often returns in comparisons: when childcare modes are accessible and women’s careers are not penalized, fertility intentions come true more often.
Culture, Public Policies, and Economy: Three Intersecting Levers
The cultural lever cannot be decreed. Representations of family, the place given to children in the city, and the valuing of family time influence choices. The public lever depends on budgets and organization: opening daycare places, training staff, supporting services, these are concrete projects with delays. The economic lever acts like weather: when uncertainty settles, birth plans are postponed, sometimes indefinitely.
The risk in a debate centered on “the” right model is to forget decisions in families are sensitive to stability. A one-off aid can help but doesn’t replace confidence in the future, nor an environment where the arrival of a child does not automatically mean income loss or childcare hassle. European demographic evolution shows the issue plays out over the long term, and half-measures end up showing in the figures.
Territorial Disparities in France: Regions, Overseas, and Inequalities Facing Birth Rates
Talking about France as a homogeneous block is convenient for headlines, less so to understand what is happening. The decline in births affects almost the entire territory but with exceptions and nuances. According to Insee, births remained stable in Pays de la Loire and Réunion. They slightly increased in Martinique (+1%) and Mayotte (+2%). These differences remind that demography depends on a local combination: average age of the population, economic conditions, internal migration, access to healthcare and services.
Young territories, or those attracting households of childbearing age, may resist more. Conversely, areas where the population ages and where young adults leave to study or work mechanically see their births decline. The issue is not just “how many children”: it is also “who lives here” and “at what age.” A municipality can multiply efforts to attract families, but if the employment area is fragile or housing is too expensive, the dynamic remains complicated.
Why Regional Gaps Matter for Public Services
Public services organize around volumes. Regular decline in a region can lead to adjustments that, over time, modify supply: school consolidations, redeployment of teams, restructuring of maternity services. The problem is the feedback loop: when supply decreases, attractiveness may drop, accelerating the departure of young households and thus the birth decline.
In territories where births remain stable, the challenge is different: infrastructure must be sized, recruitment done, and quality of service guaranteed. An increase of 1% or 2% may seem modest, but if capacities are already strained, the slightest surplus becomes a very concrete issue. Local budget decisions end up caught between two fires: funding child care while responding to a aging population’s needs.
Examples of Local Levers, Without Magic Wand
Communities often act on local levers. Housing is a first axis: facilitating construction, renovating, adapting supply to families, and limiting evictions. Mobility follows: transport, safety of school trips, access to health services. Early childhood policy is a third pillar: quality of daycares, schedules compatible with jobs, support for childminders.
These levers are useful, but they do not replace national orientations on work-family reconciliation, pay, and career stability. Local policy can limit damage but cannot, alone, reverse a national demographic trend. The result is a France at several speeds, where birth rates and population evolve according to sometimes opposing territorial logics, complicating planning and fueling worry.
What Do We Say About It?
The decline in births in France resembles an established trend, not a cyclical accident, and 2025 figures confirm this diagnosis. The most likely scenario is a continued decline at a less violent pace than in 2023, with increasingly visible territorial gaps. The concrete priority, if the goal is to support birth rates without incantatory speech, lies in parents’ living conditions: available childcare, accessible housing, and careers less penalized by the arrival of a child. Without this triptych, worry will remain a debate, and demographic evolution will continue writing the story on its own.
Quelle différence entre taux de natalité et indice de fécondité ?
Le taux de natalité rapporte les naissances à l’ensemble de la population, donc il dépend aussi de la part de personnes en âge d’avoir des enfants. L’indice conjoncturel de fécondité estime le nombre moyen d’enfants par femme, à partir des taux par âge observés. Les deux indicateurs peuvent baisser en même temps, mais ils ne réagissent pas aux mêmes facteurs.
Pourquoi une baisse des naissances en 2025 a-t-elle des effets des années plus tard ?
Les conséquences se déplacent avec les générations : d’abord sur la petite enfance, puis l’école primaire, le collège, l’enseignement supérieur et enfin le marché du travail. Une cohorte moins nombreuse aujourd’hui signifie moins d’entrants potentiels à chaque étape. Le décalage temporel explique pourquoi les effets semblent lents, puis deviennent visibles en série.
La France est-elle un cas isolé en Europe sur la natalité ?
Non. Les données européennes reprises par l’Insee indiquent 3,6 millions de naissances dans l’Union européenne en 2024, en baisse de 3,2 % sur un an et de 19 % sur dix ans. La France conserve un niveau de fécondité supérieur à la moyenne européenne, mais elle suit aussi une trajectoire baissière.
Quelles régions résistent le mieux à la baisse des naissances ?
Selon l’Insee, les naissances sont restées stables dans les Pays de la Loire et à La Réunion, et elles progressent légèrement en Martinique (+1 %) et à Mayotte (+2 %). Ces différences reflètent des dynamiques locales : structure d’âge, attractivité résidentielle, conditions économiques et accès aux services de santé et de garde.